
No-liquidation futures are live on ClickOptions. You can open the futures terminal and trade them now, with or without an account to look around. This article explains why we built them, how an option can act like a future, the math behind it, and what it costs. It keeps the data and the replays from our research, so you can check the claims yourself.
The problem: a wick can close a correct trade
Most crypto trading is leveraged perpetual futures. Perpetuals carry about 77% of all crypto volume, and more than 80% of Binance futures traders use 20× or more. At 20×, a move of about 5% against you liquidates the position.
A perpetual liquidates on a touch, not on a close. If the index price touches your liquidation level for one second, and then snaps back, your margin is gone. You do not get the recovery. The leverage you bought is exposure plus a trapdoor with a random timer. You can be right about the week and still lose everything to one wick.
This is not a rare event. In 2025 about $150 billion was liquidated, roughly $450 million every day. On October 10, 2025 one night took $19 billion from 1.6 million traders, most of them longs.
The same trade, 801 times
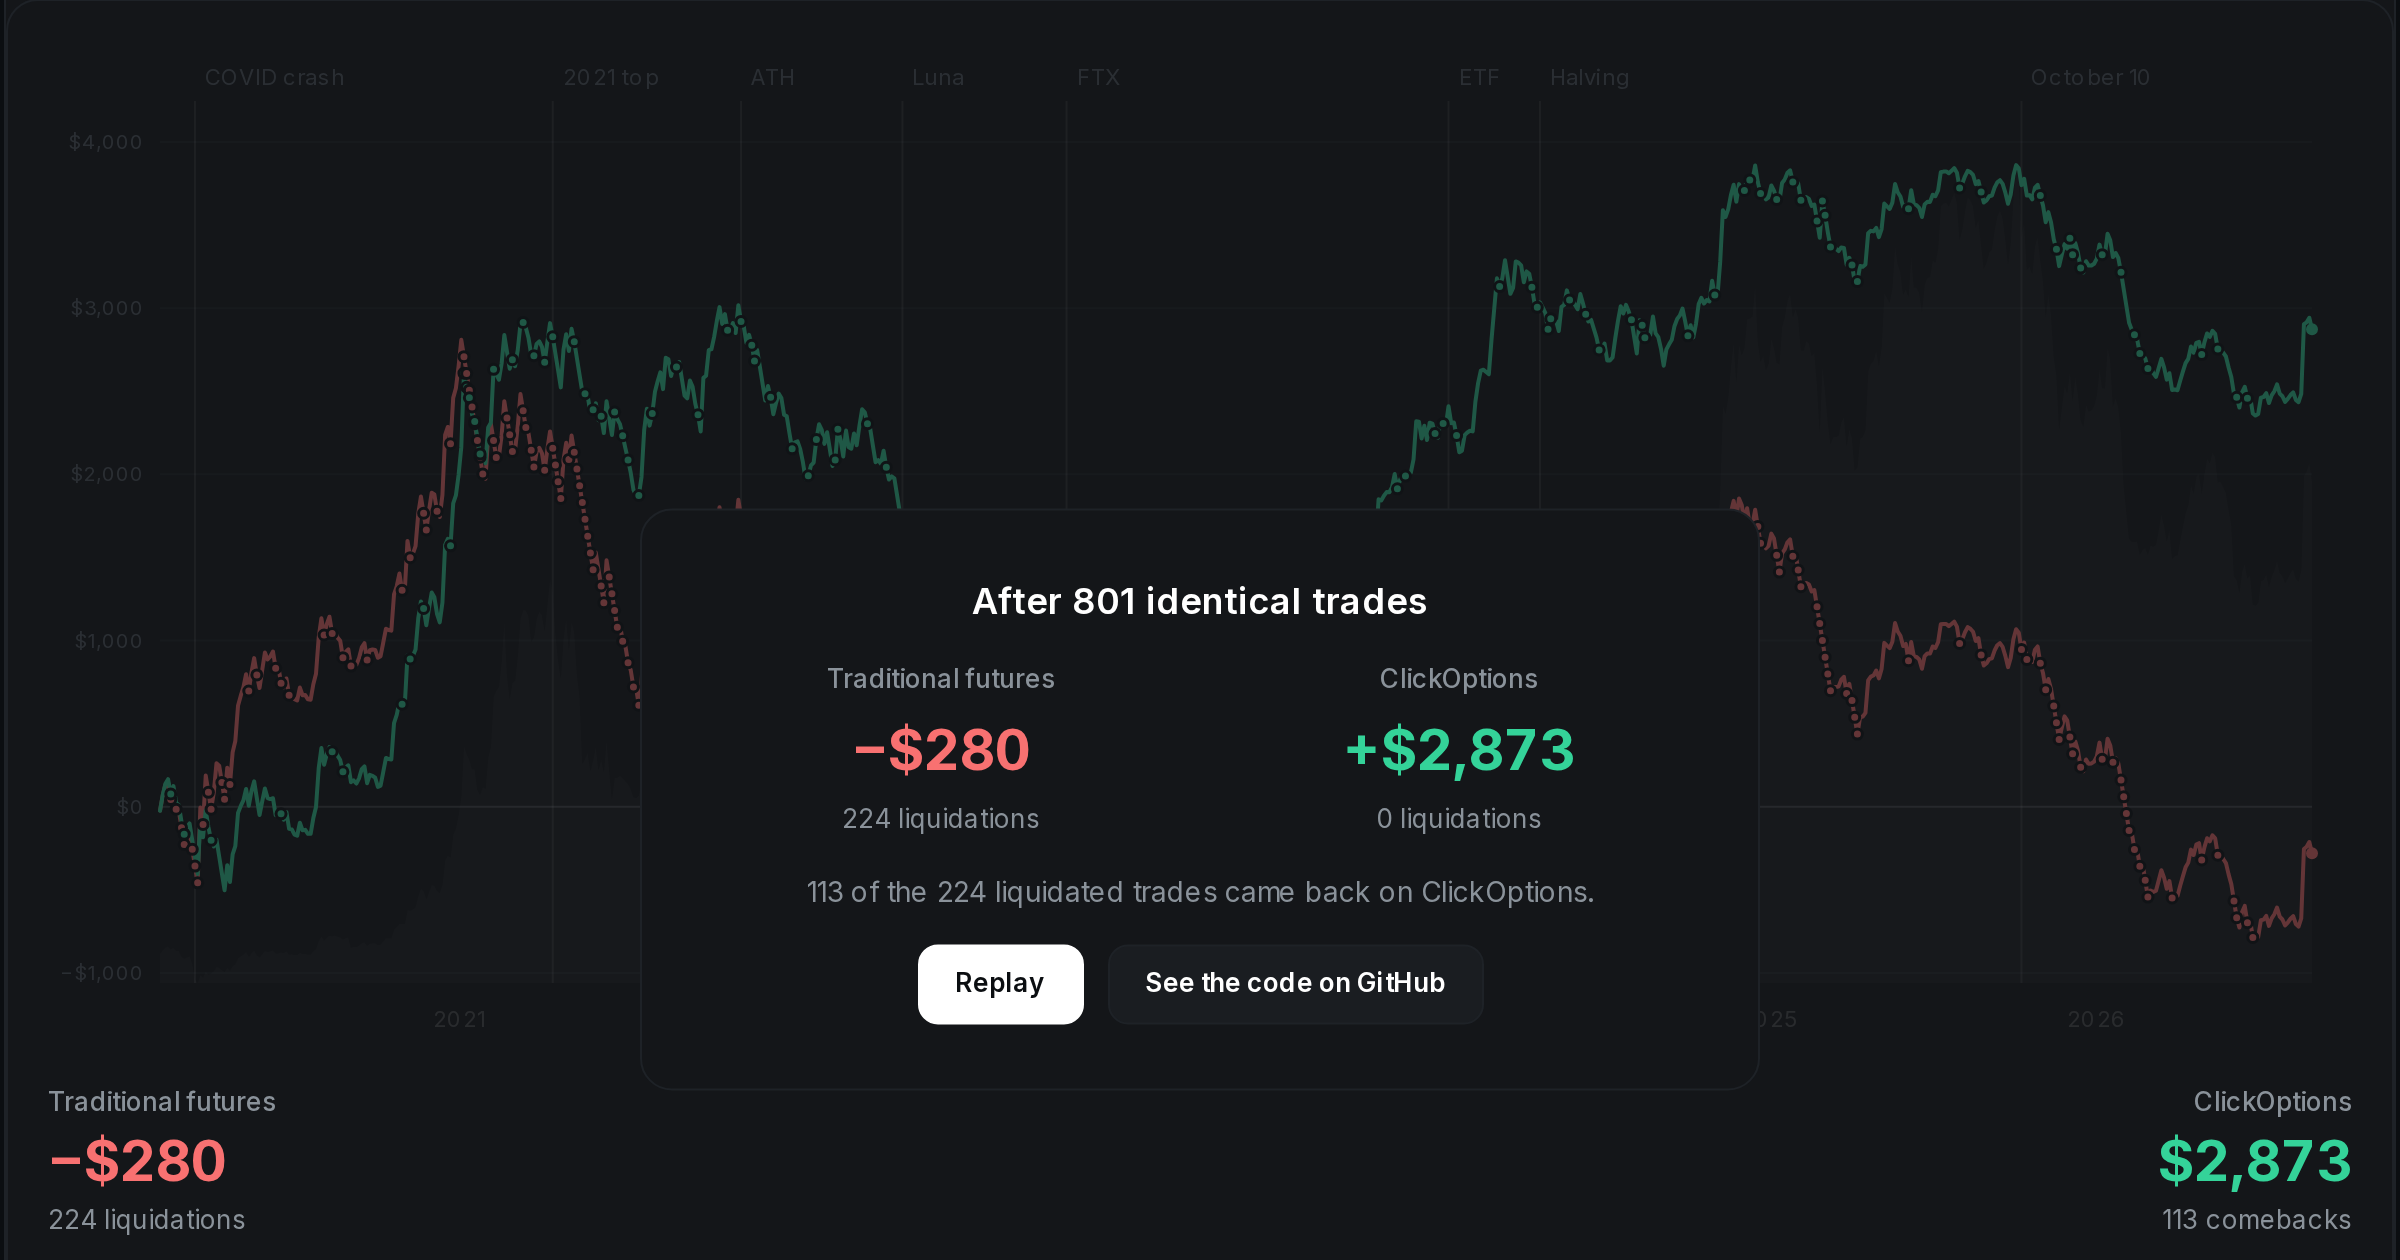
We replayed one simple strategy on real Bitcoin prices since January 2020: open a $100 long at 20× every 3 days, and hold it for 3 days. We ran it twice.
- Red line: a normal futures exchange. When the price touches the liquidation level, the trade closes and the $100 is gone.
- Green line: ClickOptions. Nothing closes the trade. The most one trade can lose is $100.
The replay below runs on its own when it comes into view. Watch what the sudden drops do to each line.
801 trades, 2020 to 2026. Open the full-screen version or read the code and the data on GitHub.
The night of October 10
The biggest crash of 2025 is the clearest example. The replay below follows the real BTCUSDT candles through that night in four steps: the entry, the touch of the liquidation level, the low, and the recovery. On a perpetual, the position ends at step two. On ClickOptions, the same position is still open at step four.
Real BTCUSDT data, October 10 to 11, 2025. Open the full-screen version.
What the trader sees
The terminal works like the futures you already trade. Three steps:
- Pick a side and a leverage. Long or short. Leverage up to 30×. The ticket looks like every futures ticket you have used.
- Buy, and watch it move with the price. Your position moves one to one with the price, times your leverage. There is no liquidation price on the screen, because there is none.
- Hold, close, or let it settle. Close any time. Or hold to the settlement date, where the position settles at the market price. The most you can lose is the stake.
| Traditional futures | No-liquidation futures | |
|---|---|---|
| Liquidation price | Yes | None |
| A sudden spike through your entry | Closes your trade | Trade stays open |
| Most you can lose | Your whole margin | What you put in |
| Funding | Changes every 8 hours | Shown before you buy |
| Max leverage | Up to 125× | Up to 30× |
How an option acts like a future
Under the hood, a no-liquidation future is not a perpetual. It is a deep in-the-money option. A long is a call with a strike far below the current price. A short is a put with a strike far above it. Everything else is presentation.
The payoff
Take Bitcoin at a price S0 and a call with a strike K well below it. The price of that call is
P = (S0 − K) + T
The first term is the intrinsic value: what the option is worth if it settles right now. The second term, T, is the time value. For a deep in-the-money option, T is small, because the market is almost sure the option will settle in the money.
When the price moves to S1, the intrinsic value moves by exactly S1 − S0. The option's delta is close to 1, so the position moves one to one with Bitcoin. That is the behaviour of a future.
The leverage
You paid P to control the move of one coin worth S0. The leverage is the ratio:
L = S0 / P = S0 / (S0 − K + T)
Example: Bitcoin at $100,000, a strike at $95,000, a time value of $150. The option costs $5,150, and the leverage is about 19×. The closer the strike is to the price, the higher the leverage. The terminal shows the live maximum on each contract, and the leverage you pick selects the strike for you.
The profit and loss statement
When you close, the result splits into two parts:
Net P&L = (S1 − S0) + (T1 − T0)
The first bracket is the trade: the price move, one to one. The second bracket is the change in time value. Time value falls as settlement approaches, so this bracket is usually a small cost. We show it as funding. The statement in the terminal reads Trade P&L − Funding = Net P&L, line for line like a perpetual statement, and the three columns always add up.
The funding differs from a perpetual in two ways. You see the total to settlement before you buy. And you pay only for the time you hold: close early, and the unused time value comes back in the close price.
Why it cannot be liquidated
You paid P in full. There is no margin, no loan, and no debt to the exchange. The worst case is an option that settles worthless, and that costs exactly P. Nothing in the contract depends on the path of the price before settlement. The price can fall below K on Friday night and come back on Monday, and the position is untouched. Only the price at the moment you close, or at settlement, matters.
There is one more effect in your favour. As the price falls towards K, the delta falls below 1. The position loses slower than a future does near your maximum loss. A perpetual does the opposite: near the liquidation level it loses everything at once.
A position can settle worth less than its cost, but never less than zero.
What it costs
Two numbers, both known before you click. You open at the mark price plus a small spread, about 0.7% of the stake, and you close at the mark price. The spread is the trading cost, paid once. Funding, the time value, accrues while you hold. On a $100 trade it is about $0.70 per day, and the terminal shows the hourly estimate and the total to settlement before you buy.
Compare that with a perpetual. The maximum loss there is also everything you put in. The difference is how you get there: a perpetual gets there on a wick, ClickOptions only on your own decision or at settlement.
How often the wick hits
A perpetual dies on a touch, so the one question that matters is how often Bitcoin moves far enough within a day to liquidate you. No model is needed, because we have the tape. The table uses real BTCUSDT daily open, high and low prices from January 2020 to August 2026, 2,422 days. It shows the share of positions that an intraday move against them would have liquidated.
| Leverage | Move against you | Held 1 day | Held 1 week | Held 1 month |
|---|---|---|---|---|
| 20× most used | ±5% | ~10% | ~44% | 68–76% |
| 10× | ±10% | 1.7% | 16–19% | 43–54% |
| 5× | ±20% | 0.2% | 3.6–4.3% | 17–26% |
The ranges cover longs, killed by an intraday dip, and shorts, killed by an intraday spike. A 20× long was liquidated on 10.0% of days and 42.5% of weeks. A 20× short on 10.2% and 46.3%. The figures are conservative twice over: real maintenance margin triggers before the full 1/leverage move, and an entry during the day deepens the adverse move. Even the calmer last 12 months alone liquidated a 20× long on 37.6% of week-long holds.
That is the whole trade: a small, known cost instead of a large, random one. You know the 0.7% before you click. You never know when the wick comes.
Why this did not exist before
The building block is decades old. Deep in-the-money calls are the textbook stock-replacement trade. What is new is to price and present the option as a clean future with no liquidation. Turbos add a knock-out barrier, which is a liquidation by another name. The "no-liquidation" modes on some perpetual venues still liquidate, only later.
The reason is simple. Deep in-the-money strikes are quoted wide, or not at all, on most options venues, and a wide spread eats the trade. The product only works when a market maker quotes the deep tails tight and with a low premium, all the time. That is measured, not asserted:
| Average spread, USD | BTC daily | BTC weekly | ETH daily |
|---|---|---|---|
| ClickOptions | $7.03 | $3.56 | $0.96 |
| Deribit | $25.10 | $21.83 | $19.07 |
| Binance | $23.27 | $8.43 | $7.64 |
The ClickOptions market maker is bound by a published mandate: a quote width of at most 1.0% of mark for at-the-money series, price improvement on at least 95% of snapshots, and a two-sided presence at least 99% of the time. Tight tails are not an adjective here. They are the precondition of the product, and they are enforced.
What you still risk
This removes path risk, not direction risk. If Bitcoin is below your level at settlement, you lose your stake, the same stake a perpetual would have lost, minus every wick-out along the way. The funding is a real, small, ongoing cost, shown before you buy and charged for as long as you hold. The maximum loss is 100% of what you put in. This is leverage, not a free option.
If you auto-roll a position after a loss, the top-up that keeps your full size is new money at risk. A perpetual trader had that capital locked as margin all along. Here, committing it is your explicit choice, one switch per position.
What you buy, precisely, is every path where you were right over your horizon but a wick would have closed you first. The table above shows how often that path appears.
Try it
- Open the live futures terminal. Pick a side, pick the leverage, and read one number: max loss.
- Play "Survive the wick": one week of Bitcoin at 20×, first as a future, then on ClickOptions. It takes 30 seconds.
- Read the full paper, "The wick tax", with the complete method and the sources.
- Run the study yourself: the replay script and the data are open source under the MIT license.
Methodology and sources
Liquidation frequencies are empirical, computed from BTCUSDT daily open, high and low prices, January 2020 to August 2026, 2,422 days. A long opened at the day's open counts as liquidated over an H-day hold if the lowest low in the window falls at least 1/leverage below the entry. A short counts symmetrically if the highest high rises at least 1/leverage above the entry. Maintenance margin and intraday entries are ignored, so the figures are conservative. The 801-trade race uses the same data with a $100 long at 20×, opened every 3 days and held for 3 days.
Round-trip spread figures are measured on the live ClickOptions BTC book. Venue comparison spreads come from the ClickOptions spread benchmark. Mandate figures come from the public ClickOptions market-maker documentation. Volume, leverage and liquidation figures: perpetuals at about 77% of crypto volume and $61.8 trillion in 2025 (CryptoQuant); more than 80% of Binance futures traders at 20× or more; about $150 billion liquidated in 2025 and a $19 billion single day (CoinGlass). "Deep in the money", "delta close to 1" and "max loss equals premium" are standard options facts. This article is not investment advice.